ZRH --:--:--

Visualising semantic differential scales

Plotting User Experience Questionnaire results, where people rate a product between pairs of opposite adjectives.

Visualisation2024UX researchSurvey dataggplot2
On this page

A common way to test user experience of a product of app is to use semantic difference scales where adjectives of for example opposite meaning are placed compared. The customer must chose to what degree one of the certain adjectives is more suited.

Example

User Experience Questionnaire is a typical questionnaire used for this purpose.

Laugwitz, B., Held, T., & Schrepp, M. (2008). Construction and evaluation of a user experience questionnaire. In HCI and Usability for Education and >Work: 4th Symposium of the Workgroup Human-Computer Interaction and Usability Engineering of the Austrian Computer Society, USAB 2008, Graz, Austria, >November 20-21, 2008. Proceedings 4 (pp. 63-76). Springer Berlin Heidelberg.

Example Questionnaire: UEQ

Example Questionnaire: UEQ

Visualization using ggplot2
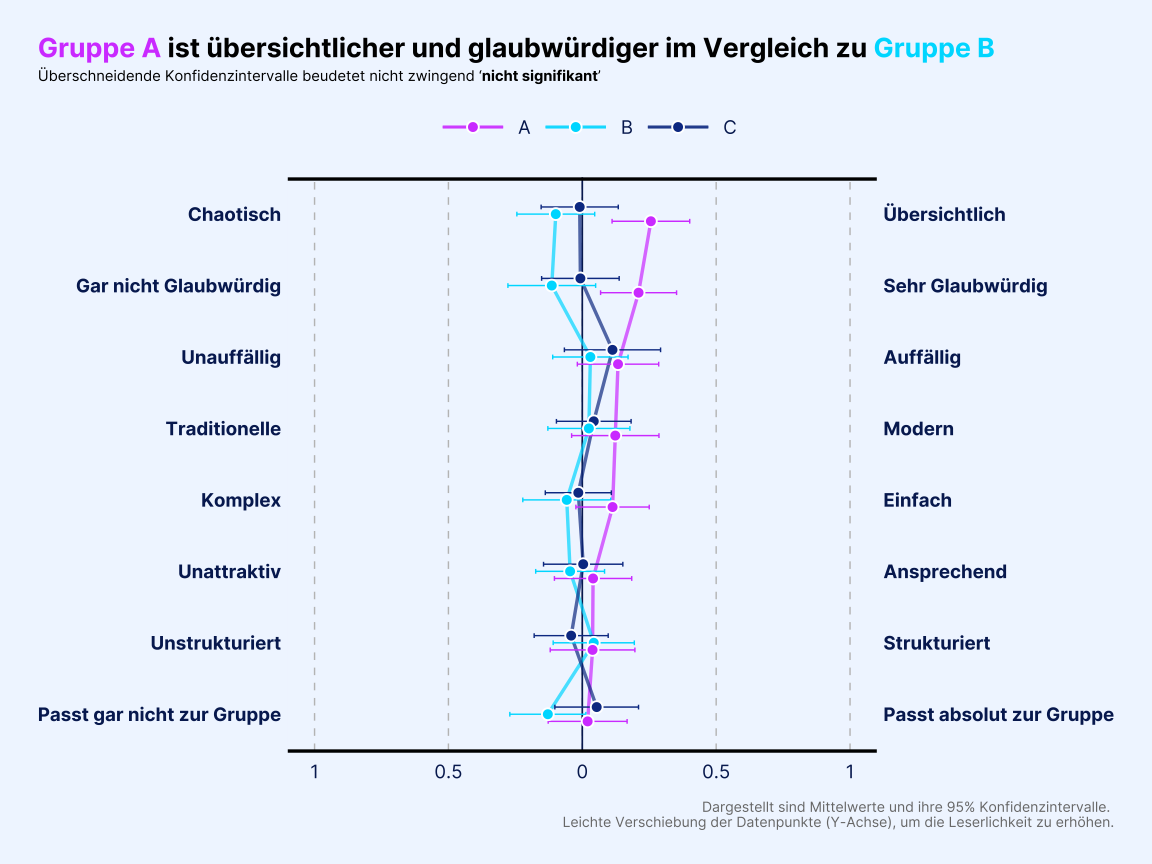
Semantic Difference with 95% Confidence intervalls

Semantic Difference with 95% Confidence intervalls

Code here

Back to top

Esc

Type at least two letters. Search covers every project and knowledge-base note.

oz@zrh: ~
QUICK DOSSIER · 30 SEC READ

OLIVER ZINGG

Psychologist and data scientist in Zürich. I design the study, model the data and explain what it means.

STATUS
Open to full-time data science roles from January 2027
NOW
Working student, data science & project management at Zurich Insurance (since Nov 2025)
THESIS
M.Sc. thesis (HSLU): leveraging double machine learning for robust decision-making, due December 2026
EDUCATION
M.Sc. Psychology (UZH, 5.6) · M.Sc. Applied Information & Data Science (HSLU, Dec 2026)
TOOLS
R, Python, SQL, Matlab · Power BI, Tableau · mixed models, ML, BERTopic

TOP CASE FILES

  1. Learning and memory formation in children and adolescents with psychiatric disordersMaster's thesis, UZH · 2023
  2. Support vector machines vs. CNNs for Alzheimer's disease classificationBachelor's thesis, UZH · 2021
  3. Simpson's paradox and mixed-effects modelsStatistics · 2023