ZRH --:--:--

Interactive presentations with Quarto

Reveal.js slides with interactive echarts4r plots, rendered to a single HTML file anyone can open.
Tools2024Quartoecharts4rReveal.js

In quarto for R environment we can create presentations that runs on revealjs. The rendered quarto file results in a HTML file that can be open in regular browsers and makes it great for sharing. Using scss the presentation can be customized. Using R packages like echarts4r we can use javascript tools for creating interactive plots. Compared to a dashboard this can be helpful to guide an audience through specific plots in a presentation style which can be easier to follow or communicate a certain message.

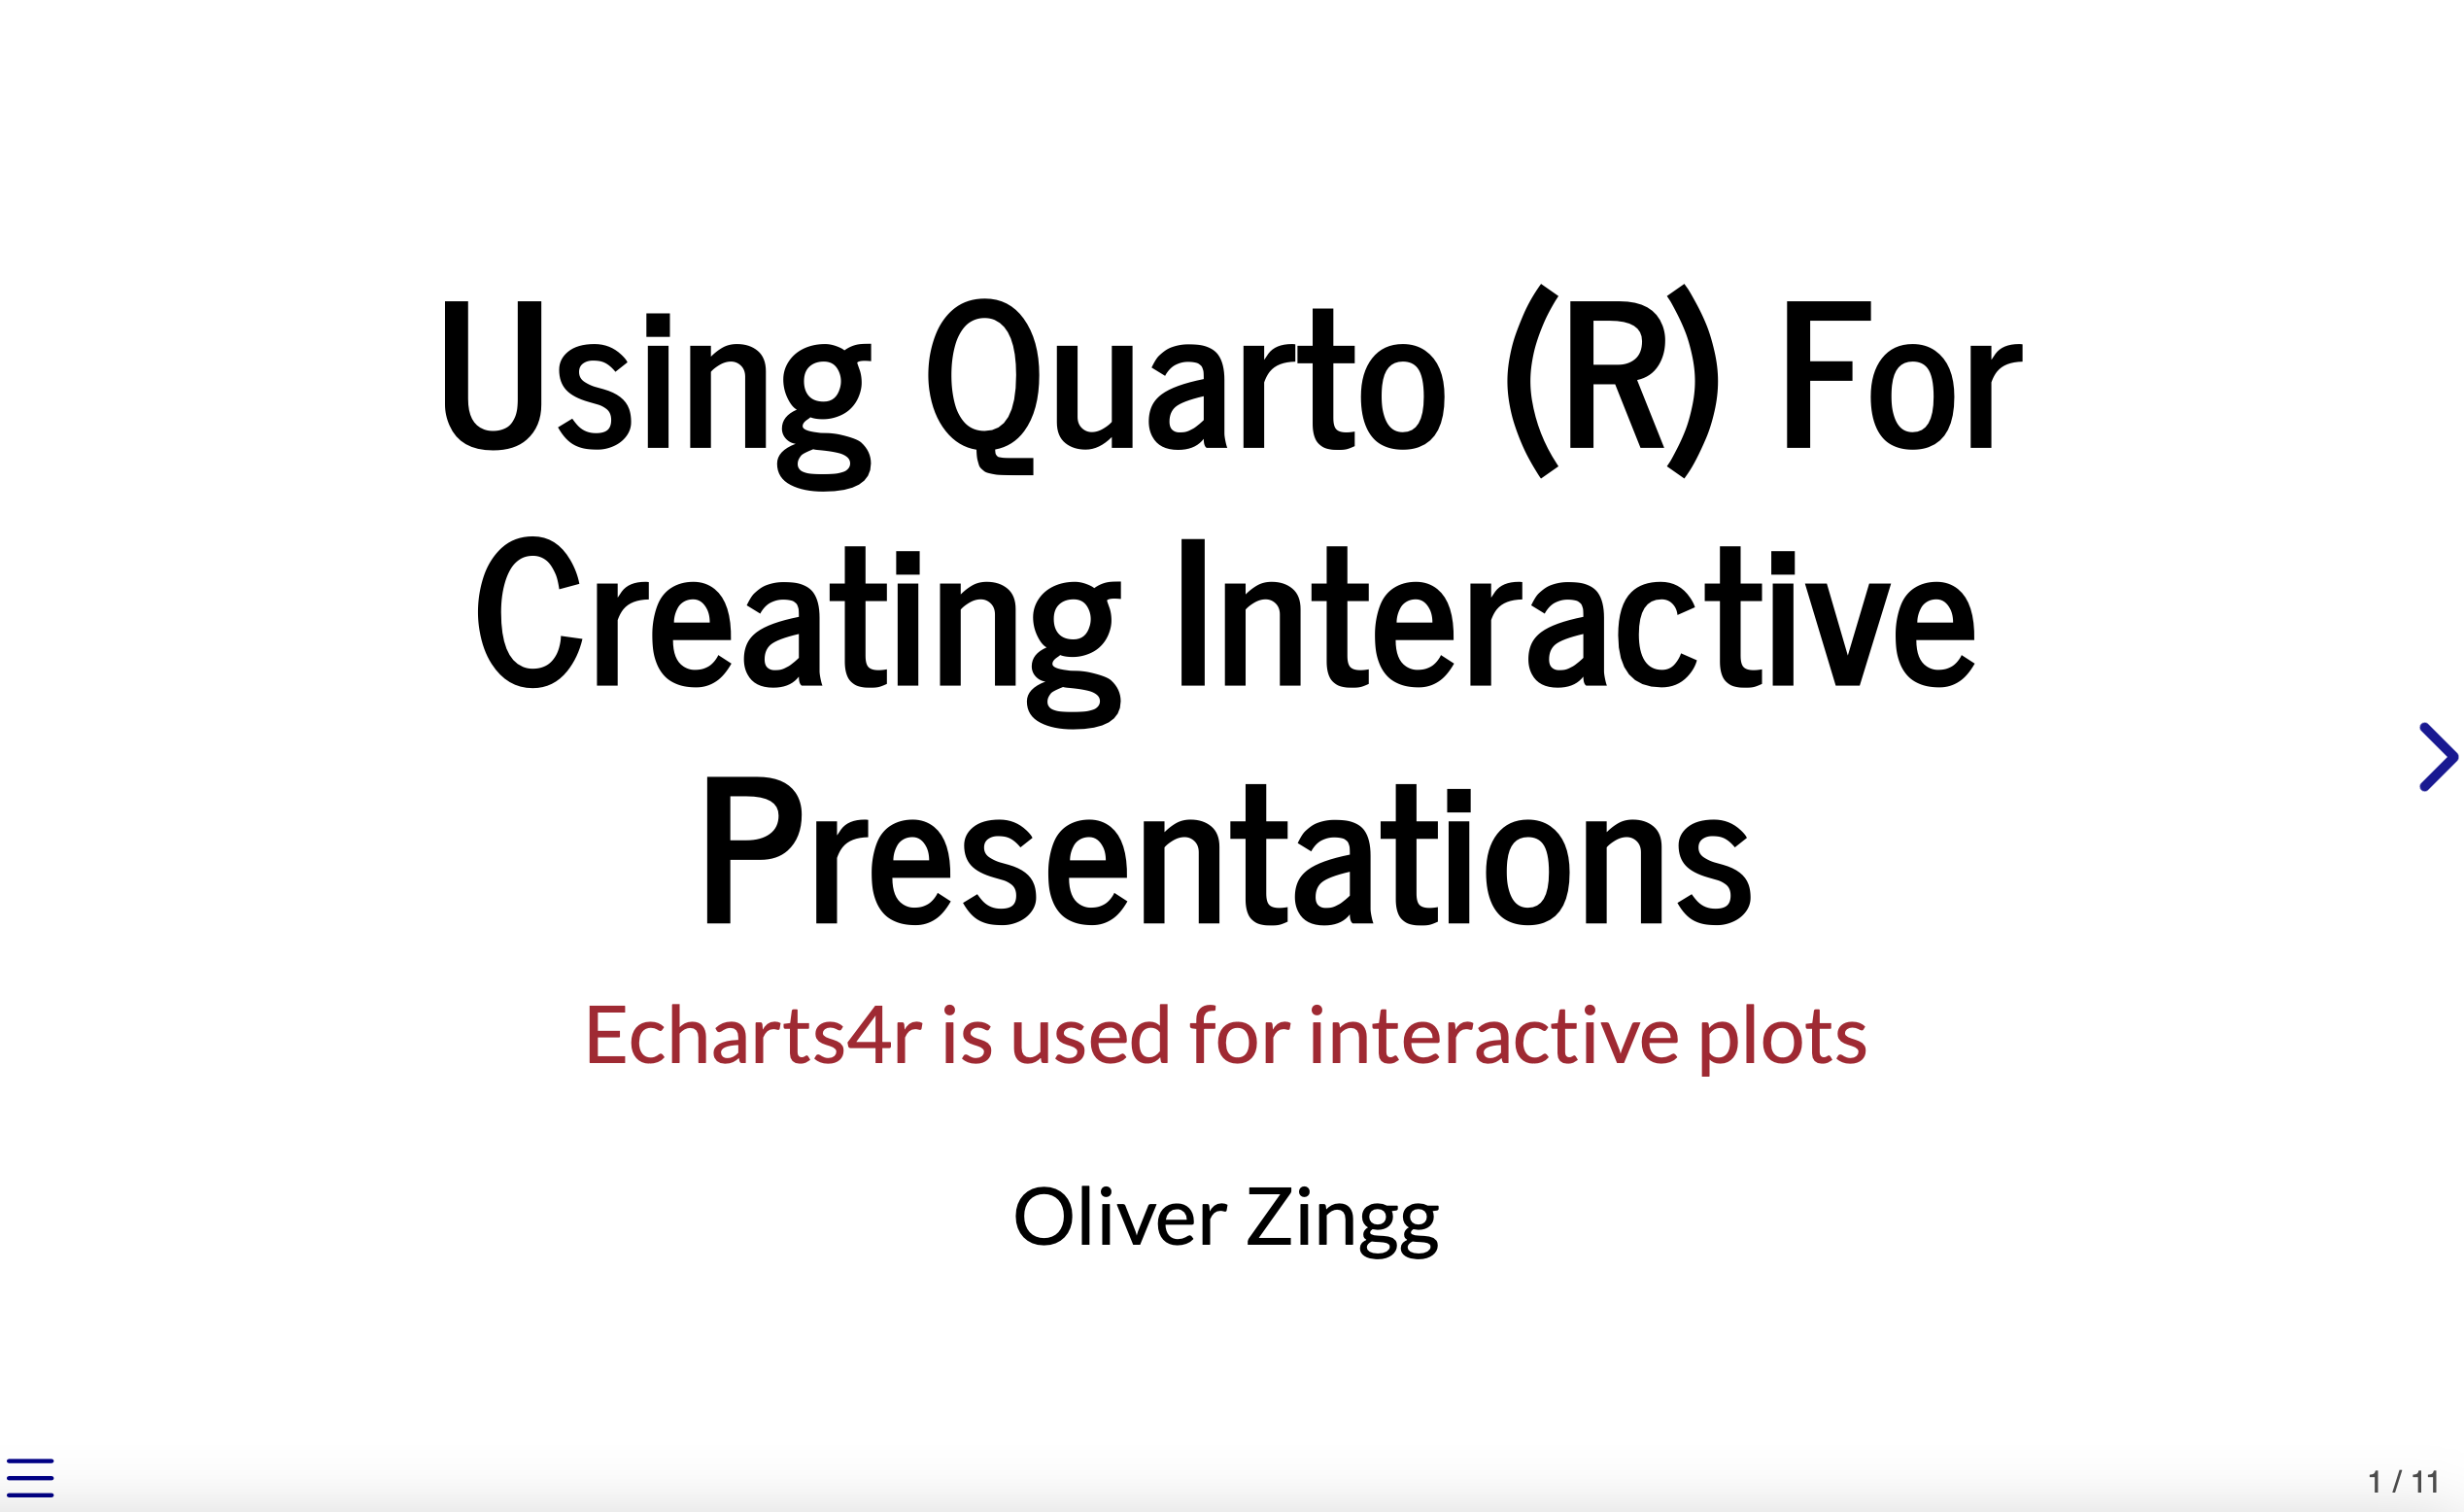
As an example here is a very simple presentation created: Link to fullscreen presentation

Using iframes we can incorporate the same presentation into this blog post but certain controls like F for fullscreen doesn’t work.

Back to top
Esc

Type at least two letters. Search covers every project and knowledge-base note.

oz@zrh: ~
QUICK DOSSIER · 30 SEC READ

OLIVER ZINGG

Psychologist and data scientist in Zürich. I design the study, model the data and explain what it means.

STATUS
Open to full-time data science roles from January 2027
NOW
Working student, data science & project management at Zurich Insurance (since Nov 2025)
THESIS
M.Sc. thesis (HSLU): leveraging double machine learning for robust decision-making, due December 2026
EDUCATION
M.Sc. Psychology (UZH, 5.6) · M.Sc. Applied Information & Data Science (HSLU, Dec 2026)
TOOLS
R, Python, SQL, Matlab · Power BI, Tableau · mixed models, ML, BERTopic

TOP CASE FILES

  1. Learning and memory formation in children and adolescents with psychiatric disordersMaster's thesis, UZH · 2023
  2. Support vector machines vs. CNNs for Alzheimer's disease classificationBachelor's thesis, UZH · 2021
  3. Simpson's paradox and mixed-effects modelsStatistics · 2023