Visualising Likert scales
Diverging bar plots that make positive and negative opinions in survey data readable at a glance.
Visualisation2024Survey dataggplot2
On this page
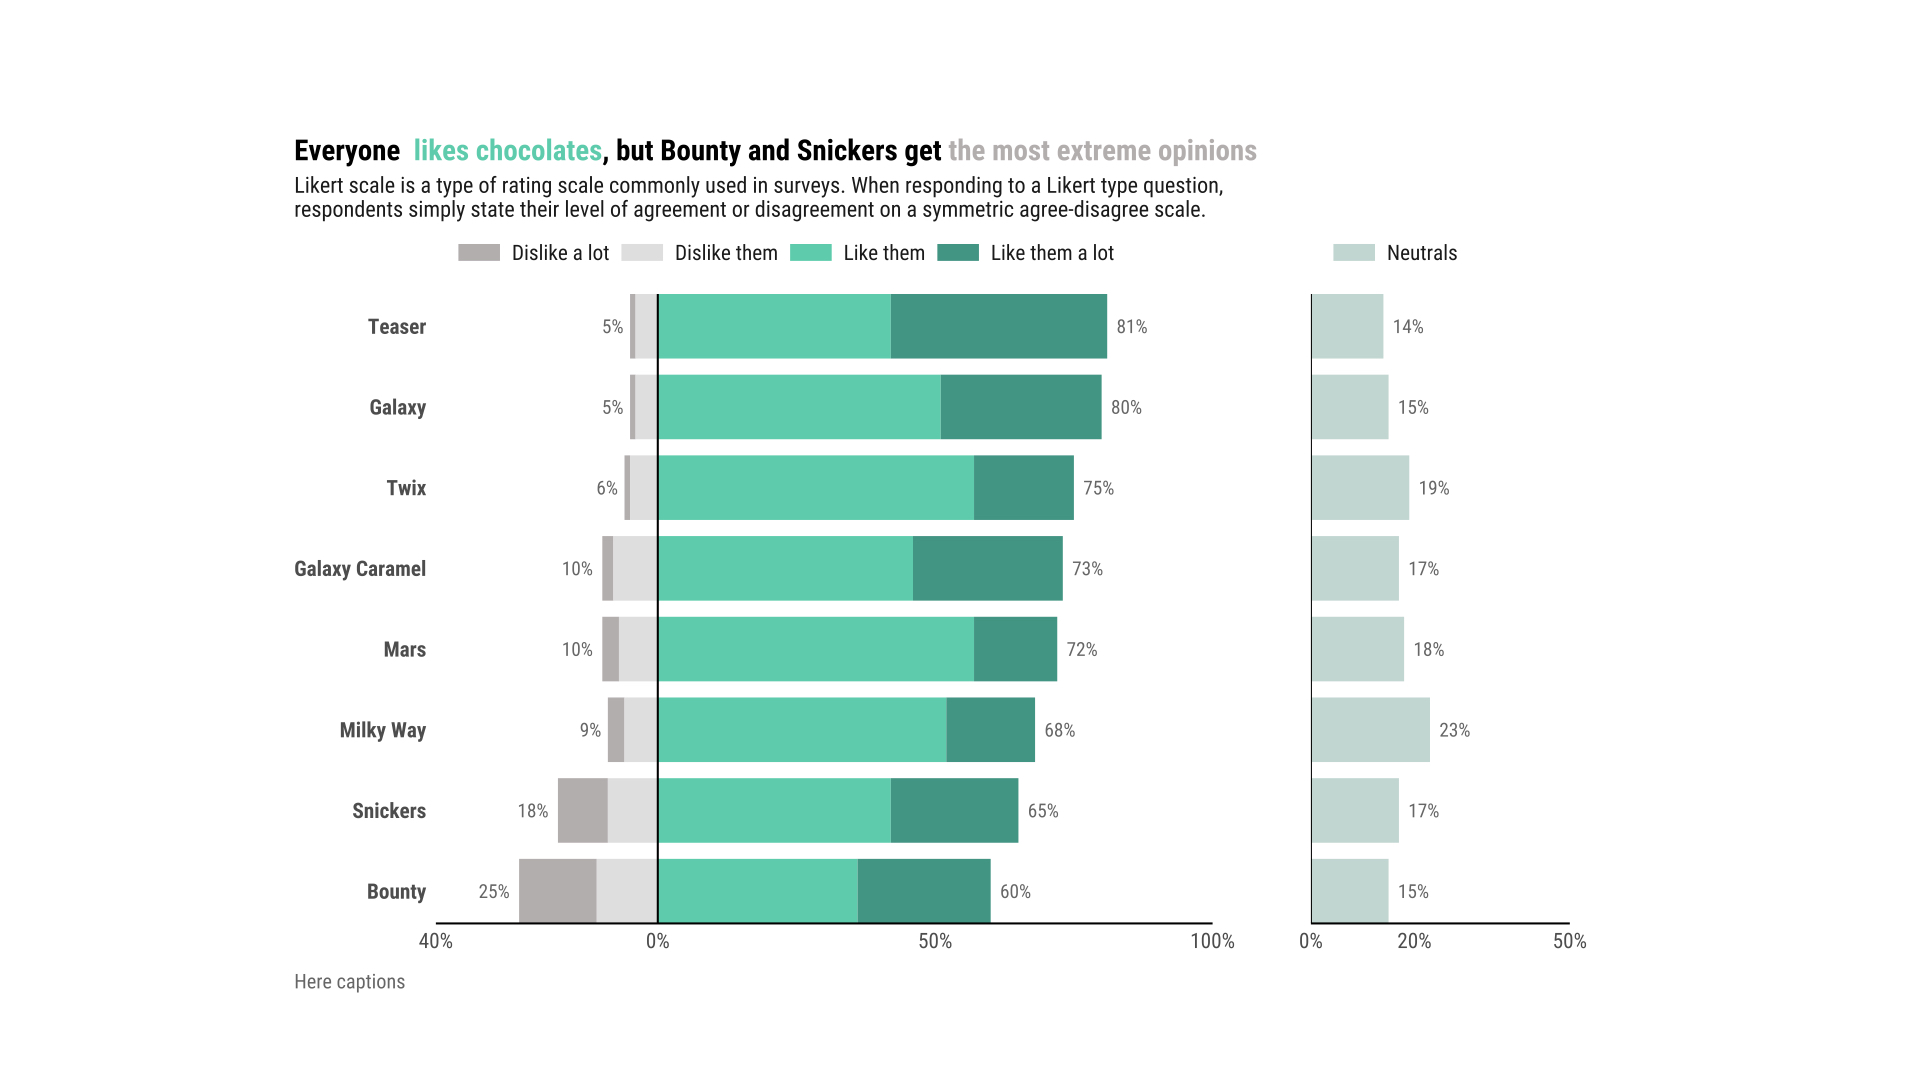
Diverging Bar plot
Of course the magic happens in ggplot2.
Likert scales are a very typical way of gathering the opinion of a sample of customers or population. One way of visualizing the results of such survey in a fast way are: diverging bar plots
When to use?
This kind of plot is useful if the main interest is the difference in size between positive and negative response. But if the main interest is to compare all opinions with each other then diverging bar plots may be the wrong choice since stacked bars with different starting points are difficult to compare visually.
Code
See github
Second version

Image Caption
Back to top